AI Analysis & Sharing
1. AI Analysis
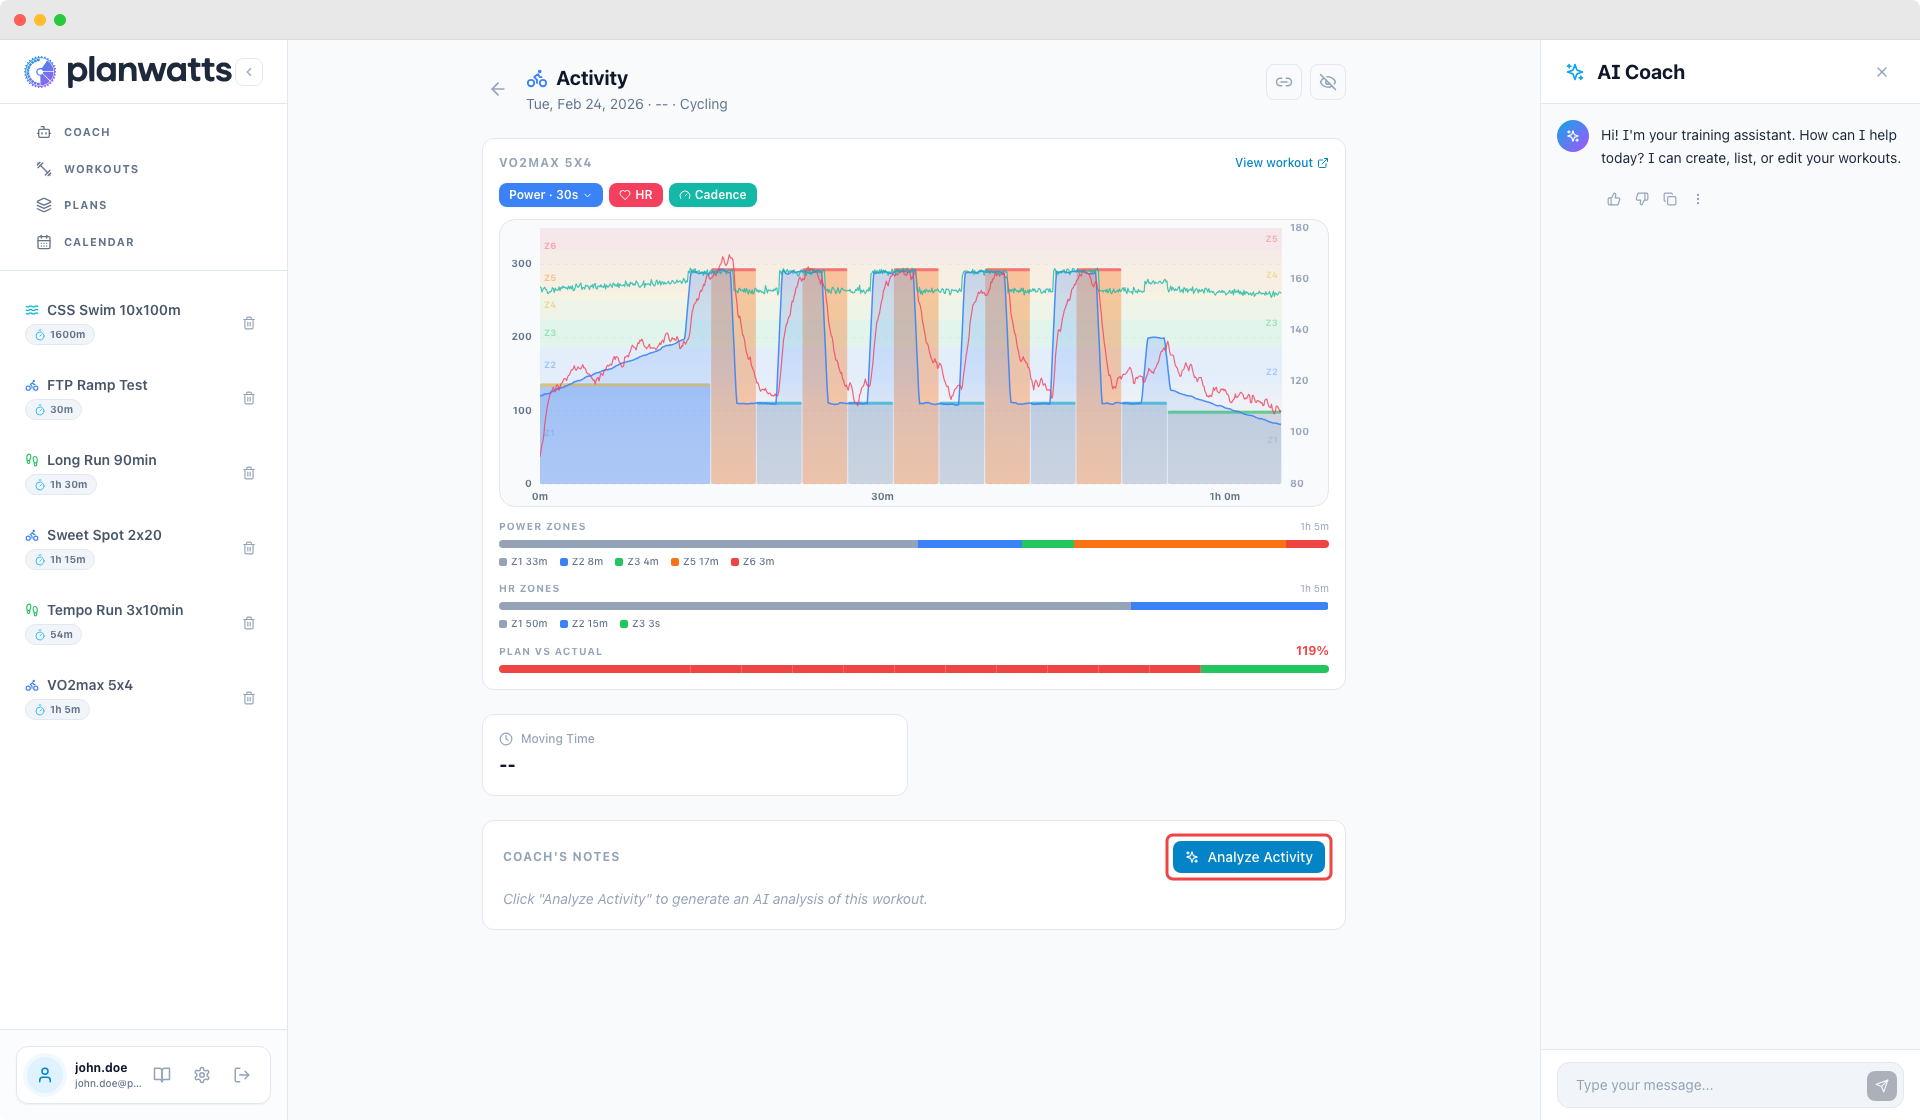
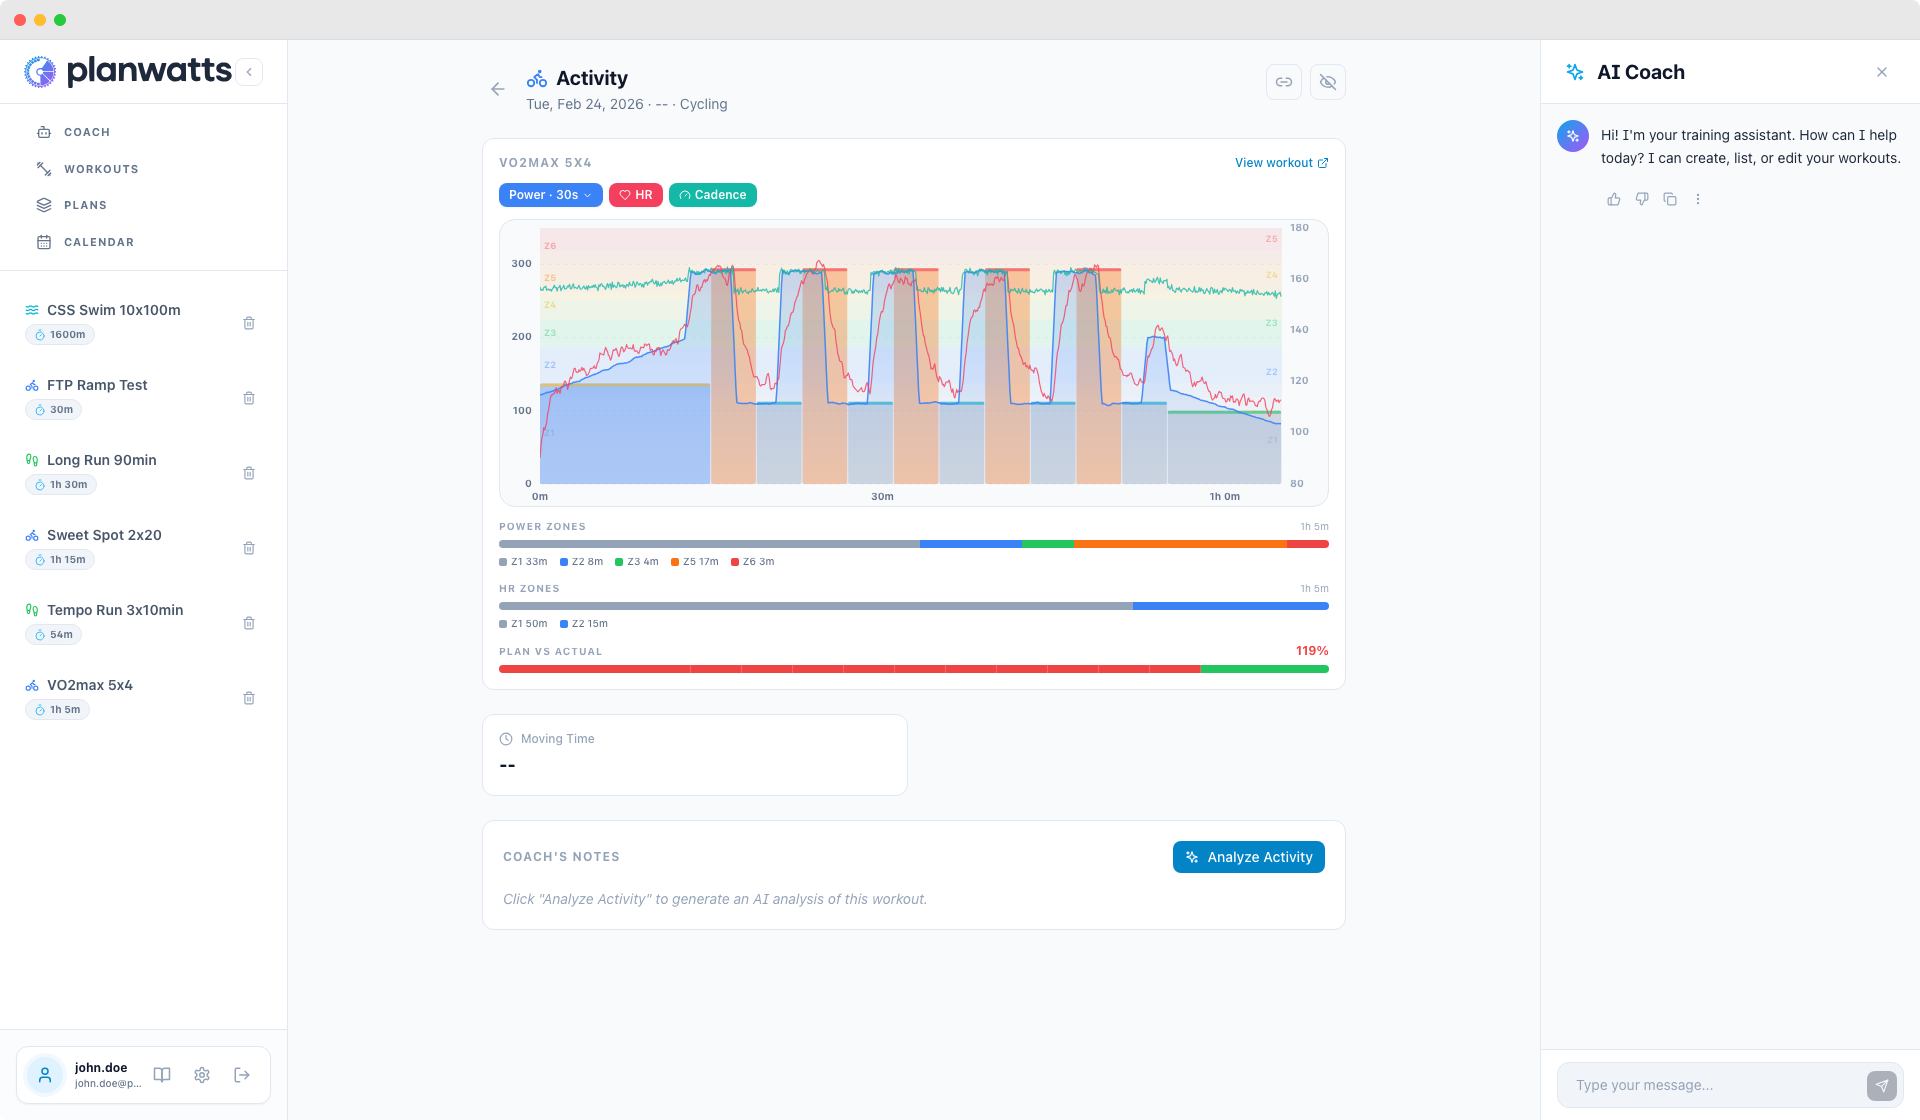
This is the core of the feature. Click the Analyze Activity button and PlanWatts generates a structured, scored analysis of your workout.
How It Works
The AI receives your full activity data — every metric, stream data, interval breakdown, planned workout (if any), and your training context. It produces a structured analysis, not just free text.
If no analysis exists yet, you see a prompt. One click, and it runs.
Scores
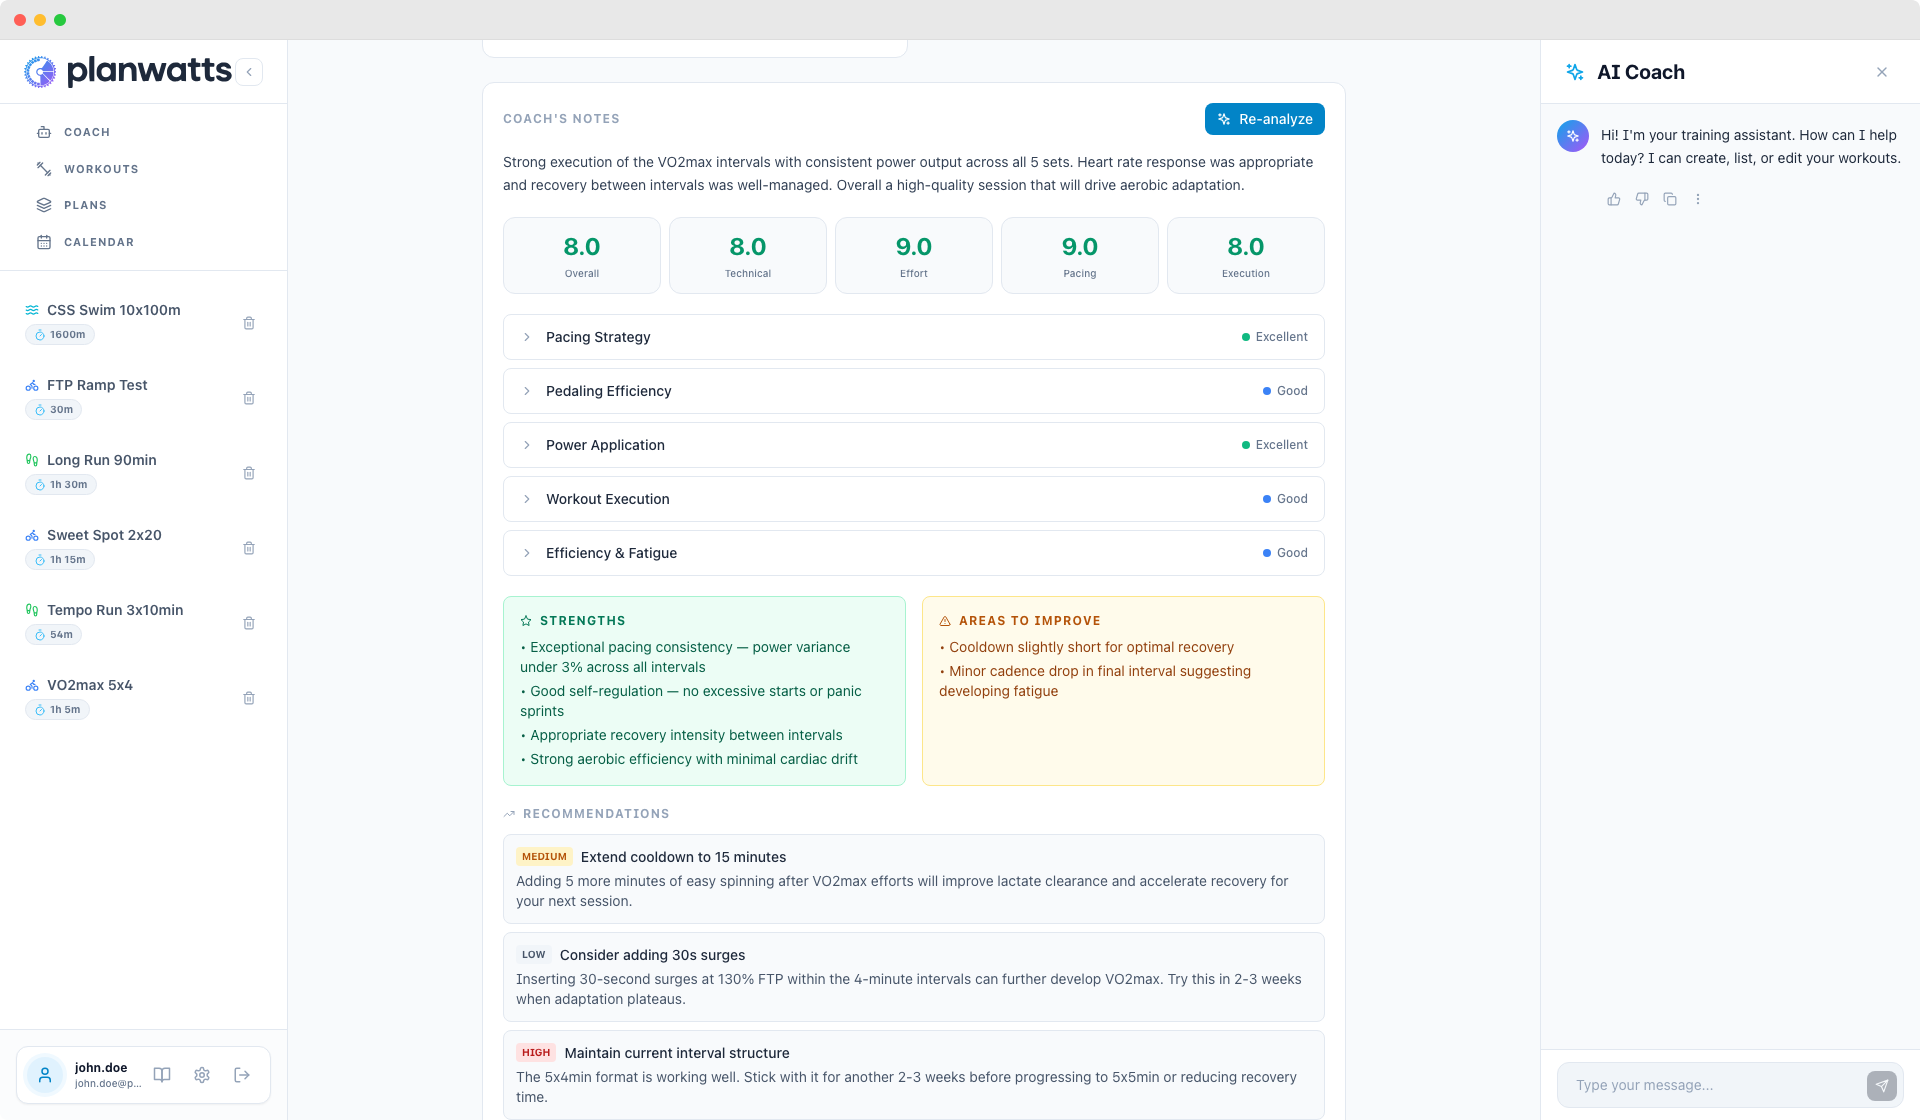
The analysis starts with numerical scores displayed as score cards:
- Overall — general execution quality
- Effort — did you work at the right intensity?
- Execution — did you follow the plan?
- Pacing — consistent or erratic?
- Technical — sport-specific skill (labeled differently per sport)
Scores adapt to the sport. Each score is on a 1-10 scale with color coding: green (8+), blue (6-8), amber (4-6), red (<4).
Executive Summary
A one-paragraph summary of the session.
Analysis Sections
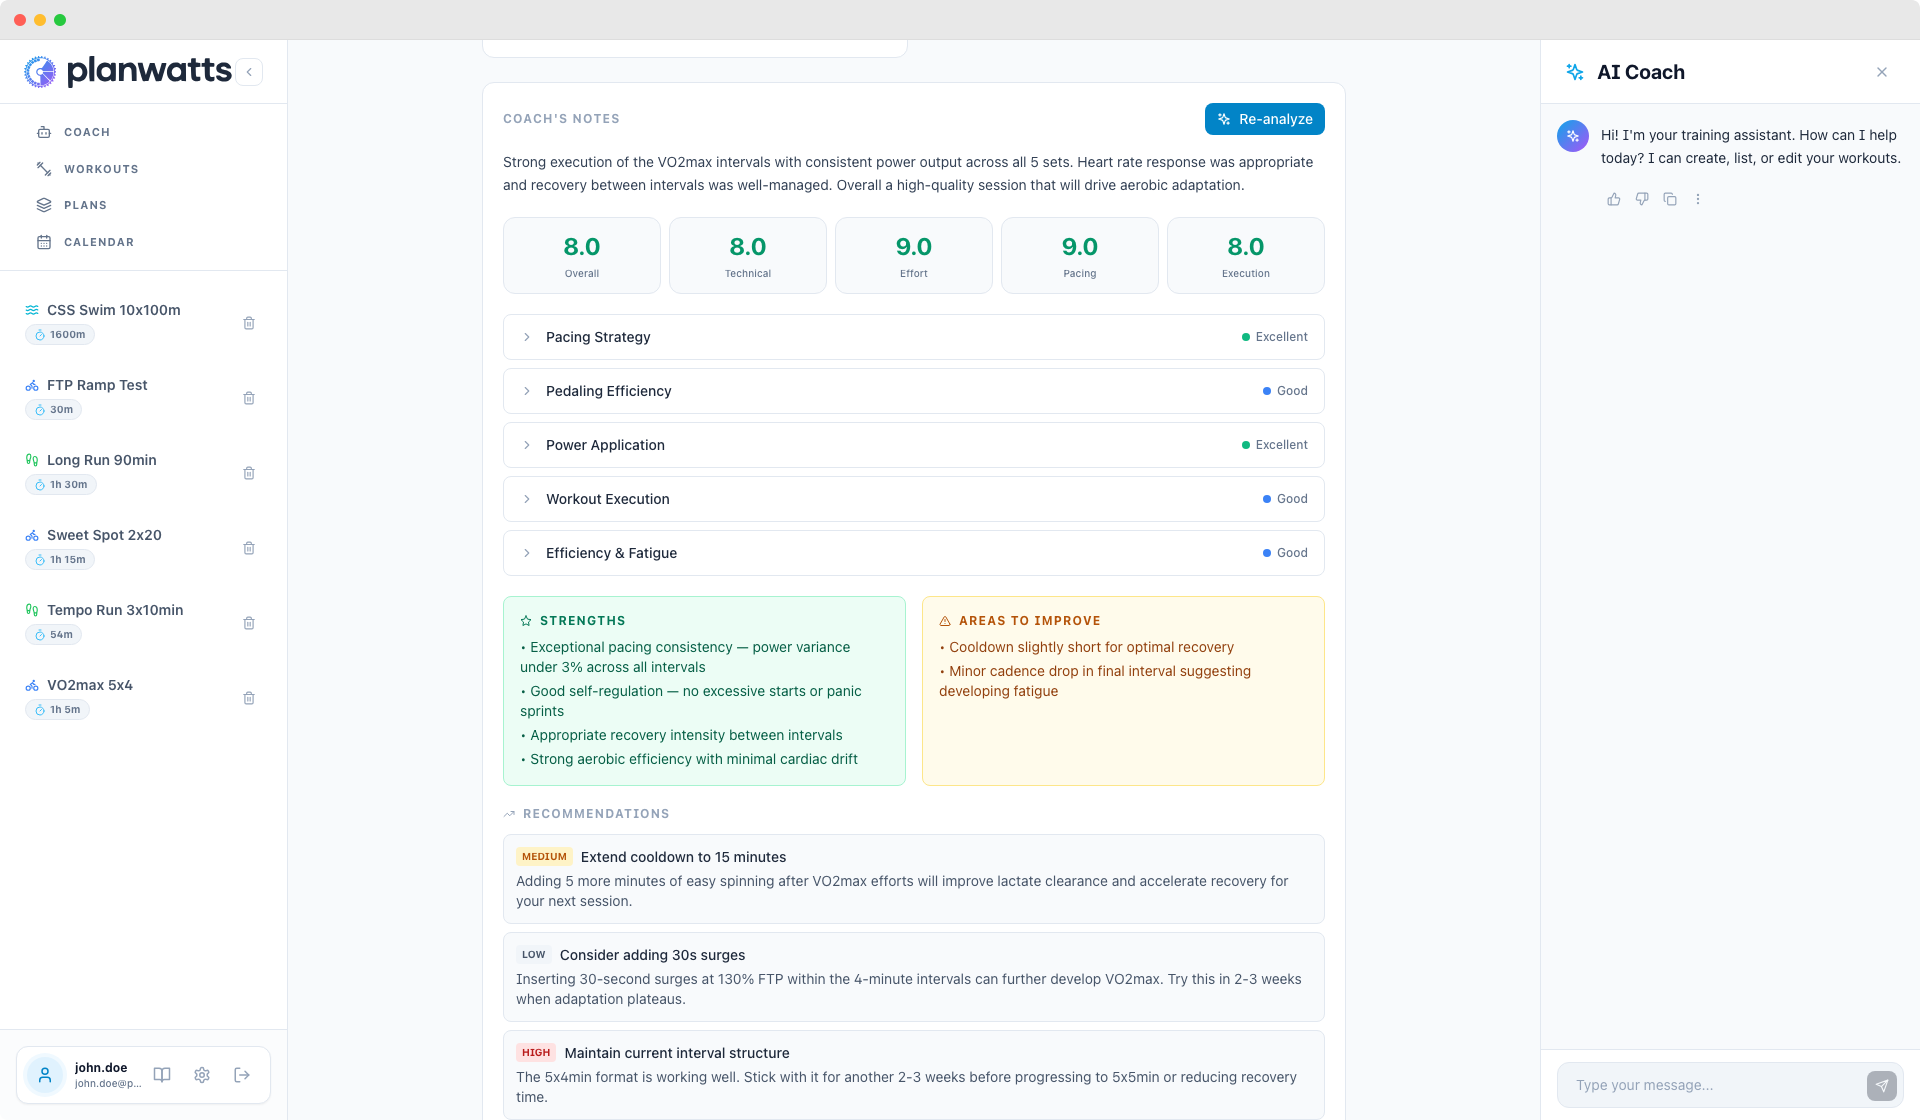
Below the summary, expandable sections dive deeper:
- Power Analysis (cycling)
- Pacing (running)
- Heart Rate Response
- Interval Execution
- Form & Technique (strength)
- Alignment (yoga)
The sections that appear depend on the sport and data available.
Strengths & Weaknesses
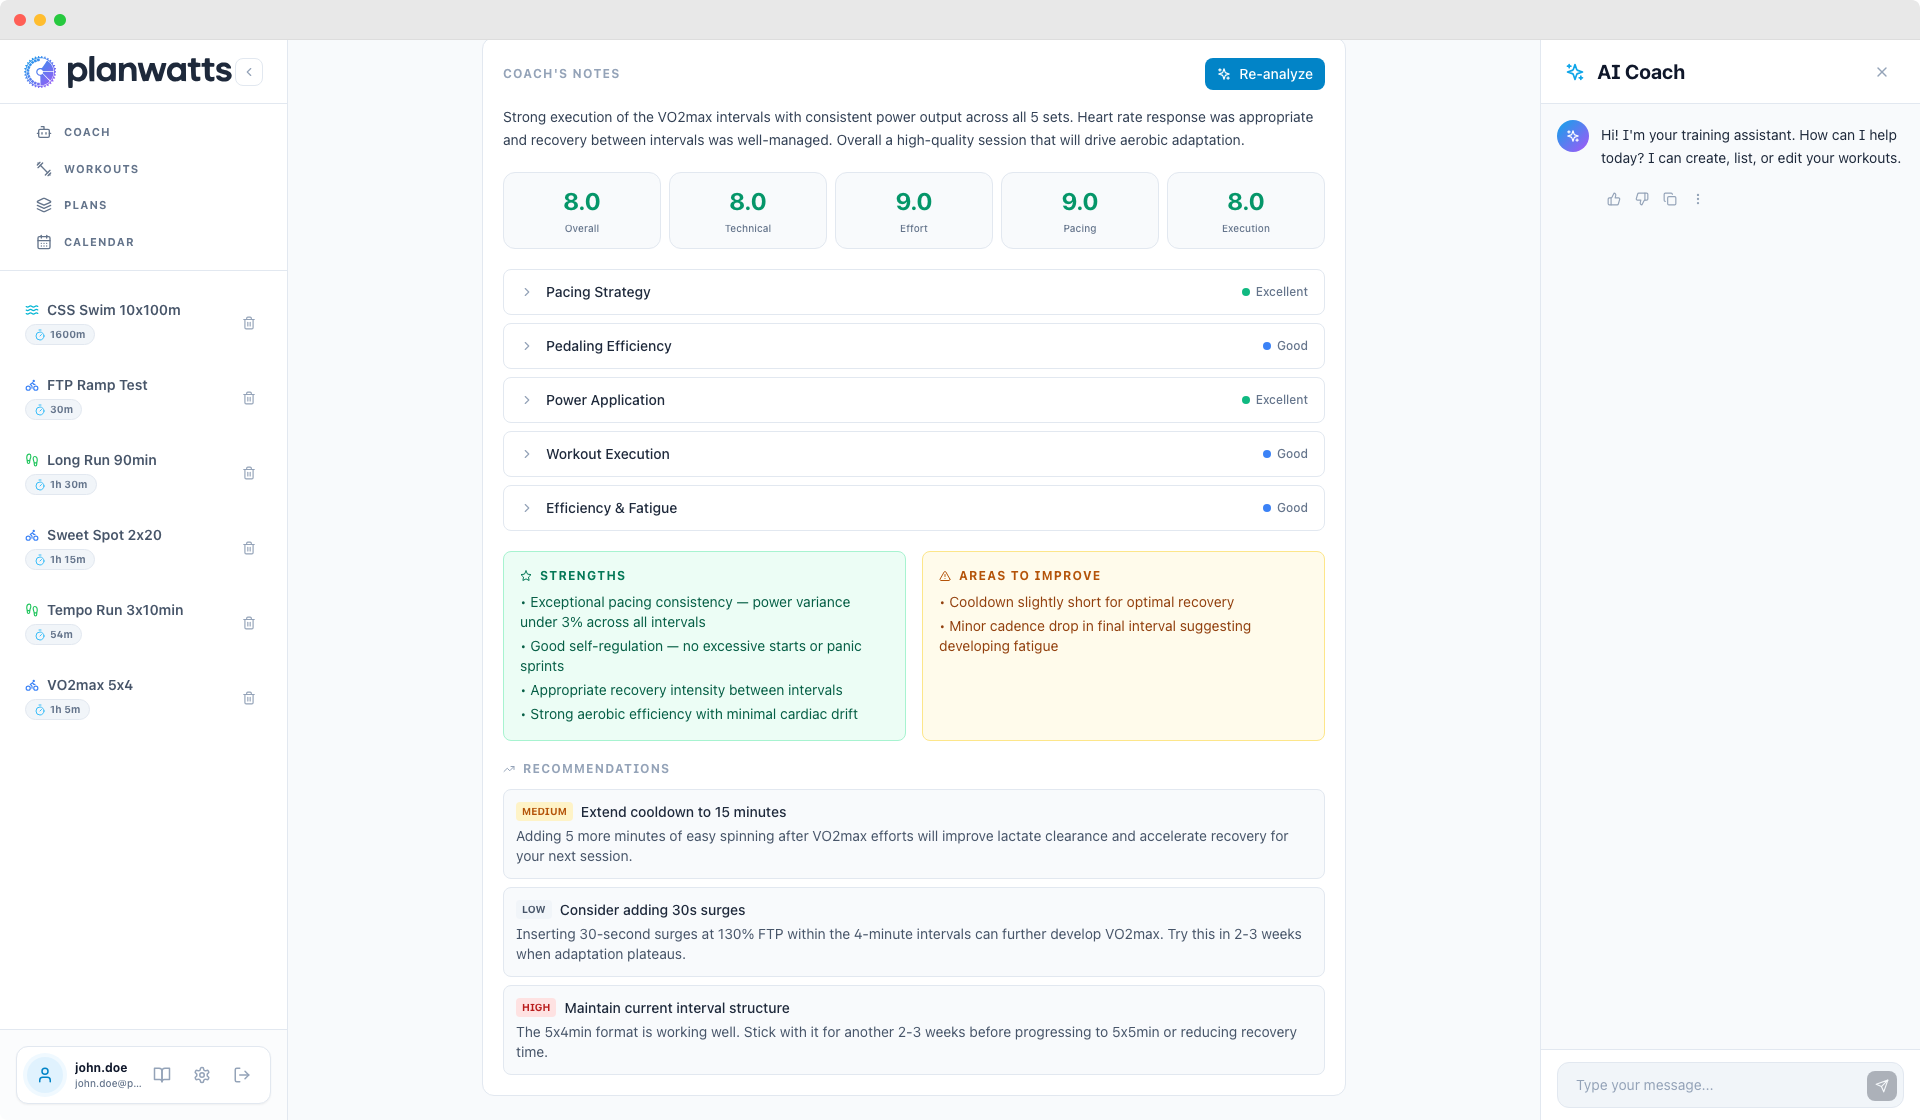
A side-by-side breakdown in green and amber cards.
Recommendations
Priority-flagged, actionable suggestions with HIGH/MEDIUM/LOW badges.
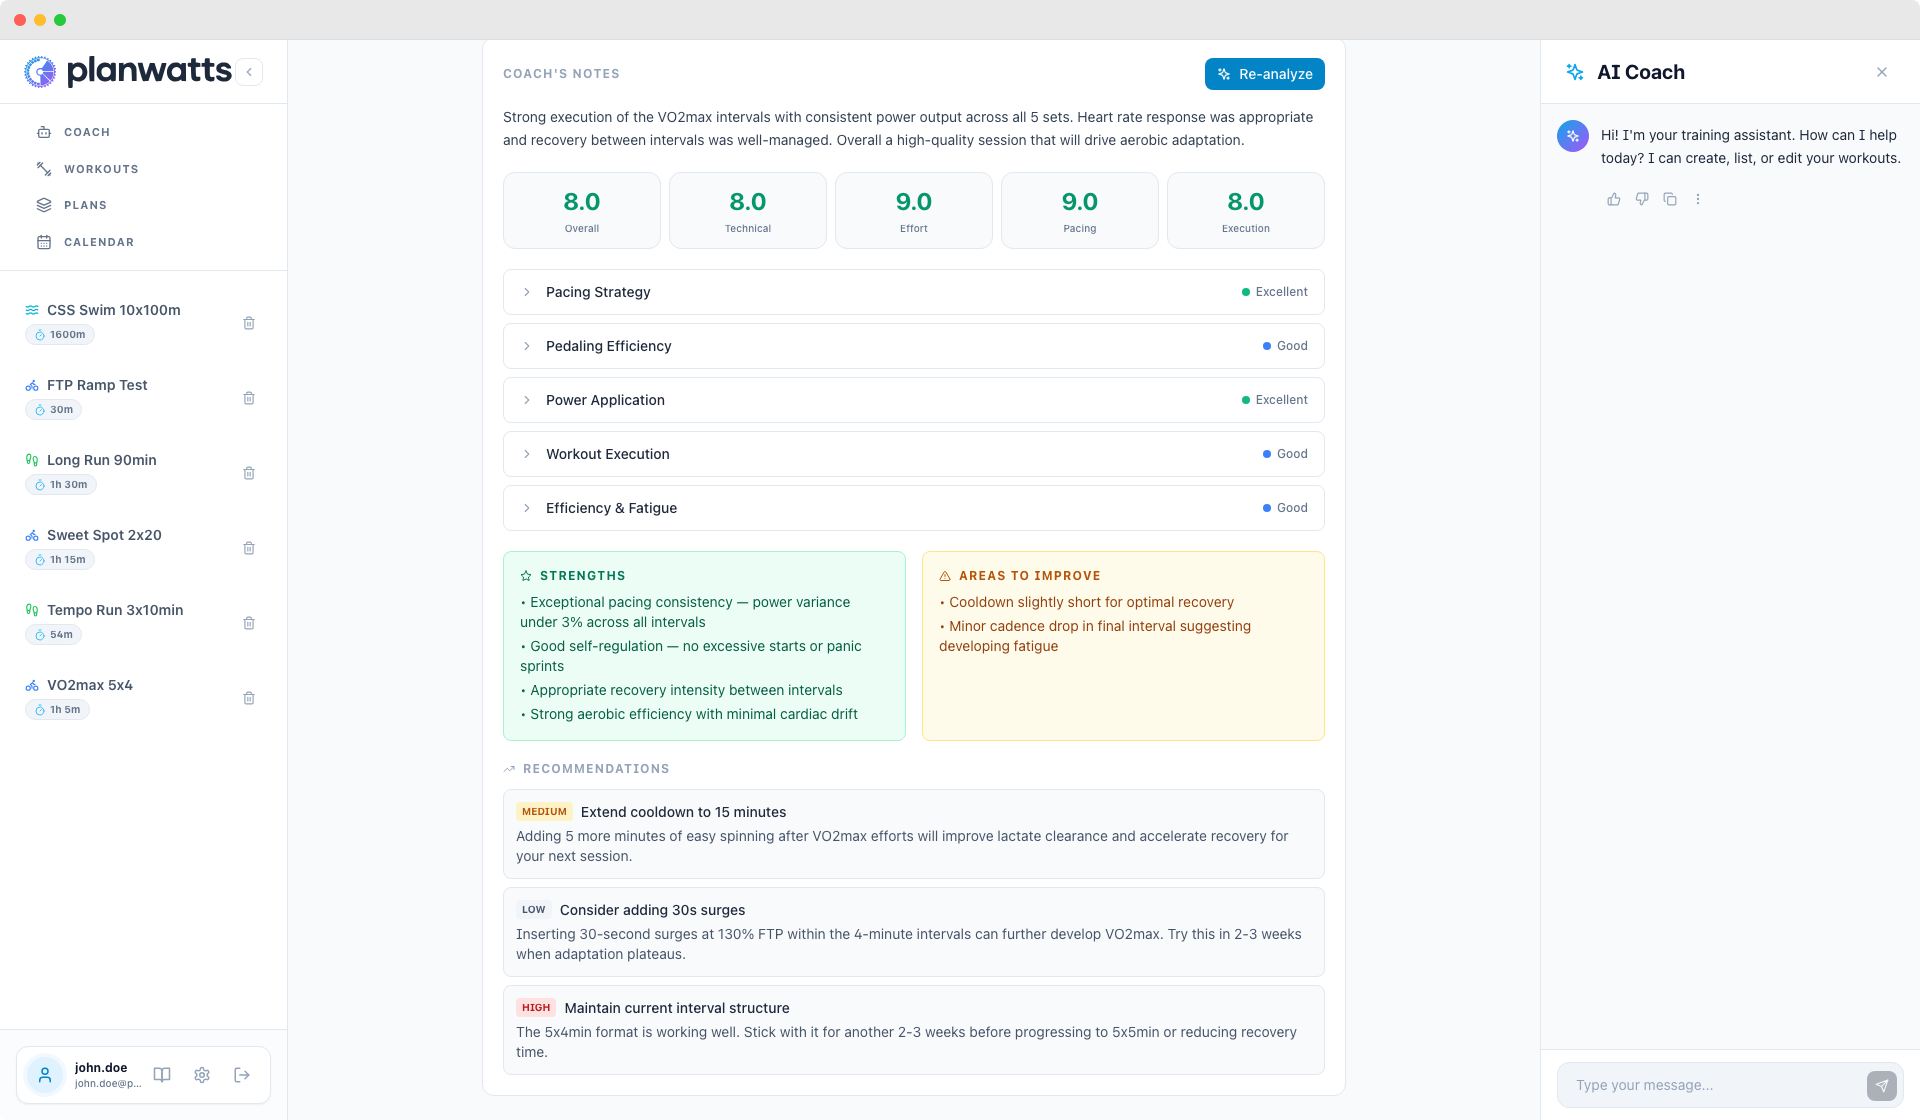
Re-analyze Button
Already ran an analysis but want a fresh one? The button changes to Re-analyze. The analysis is cached, so you won't burn credits on repeat views. And it's locale-aware.
2. Multi-Sport Support
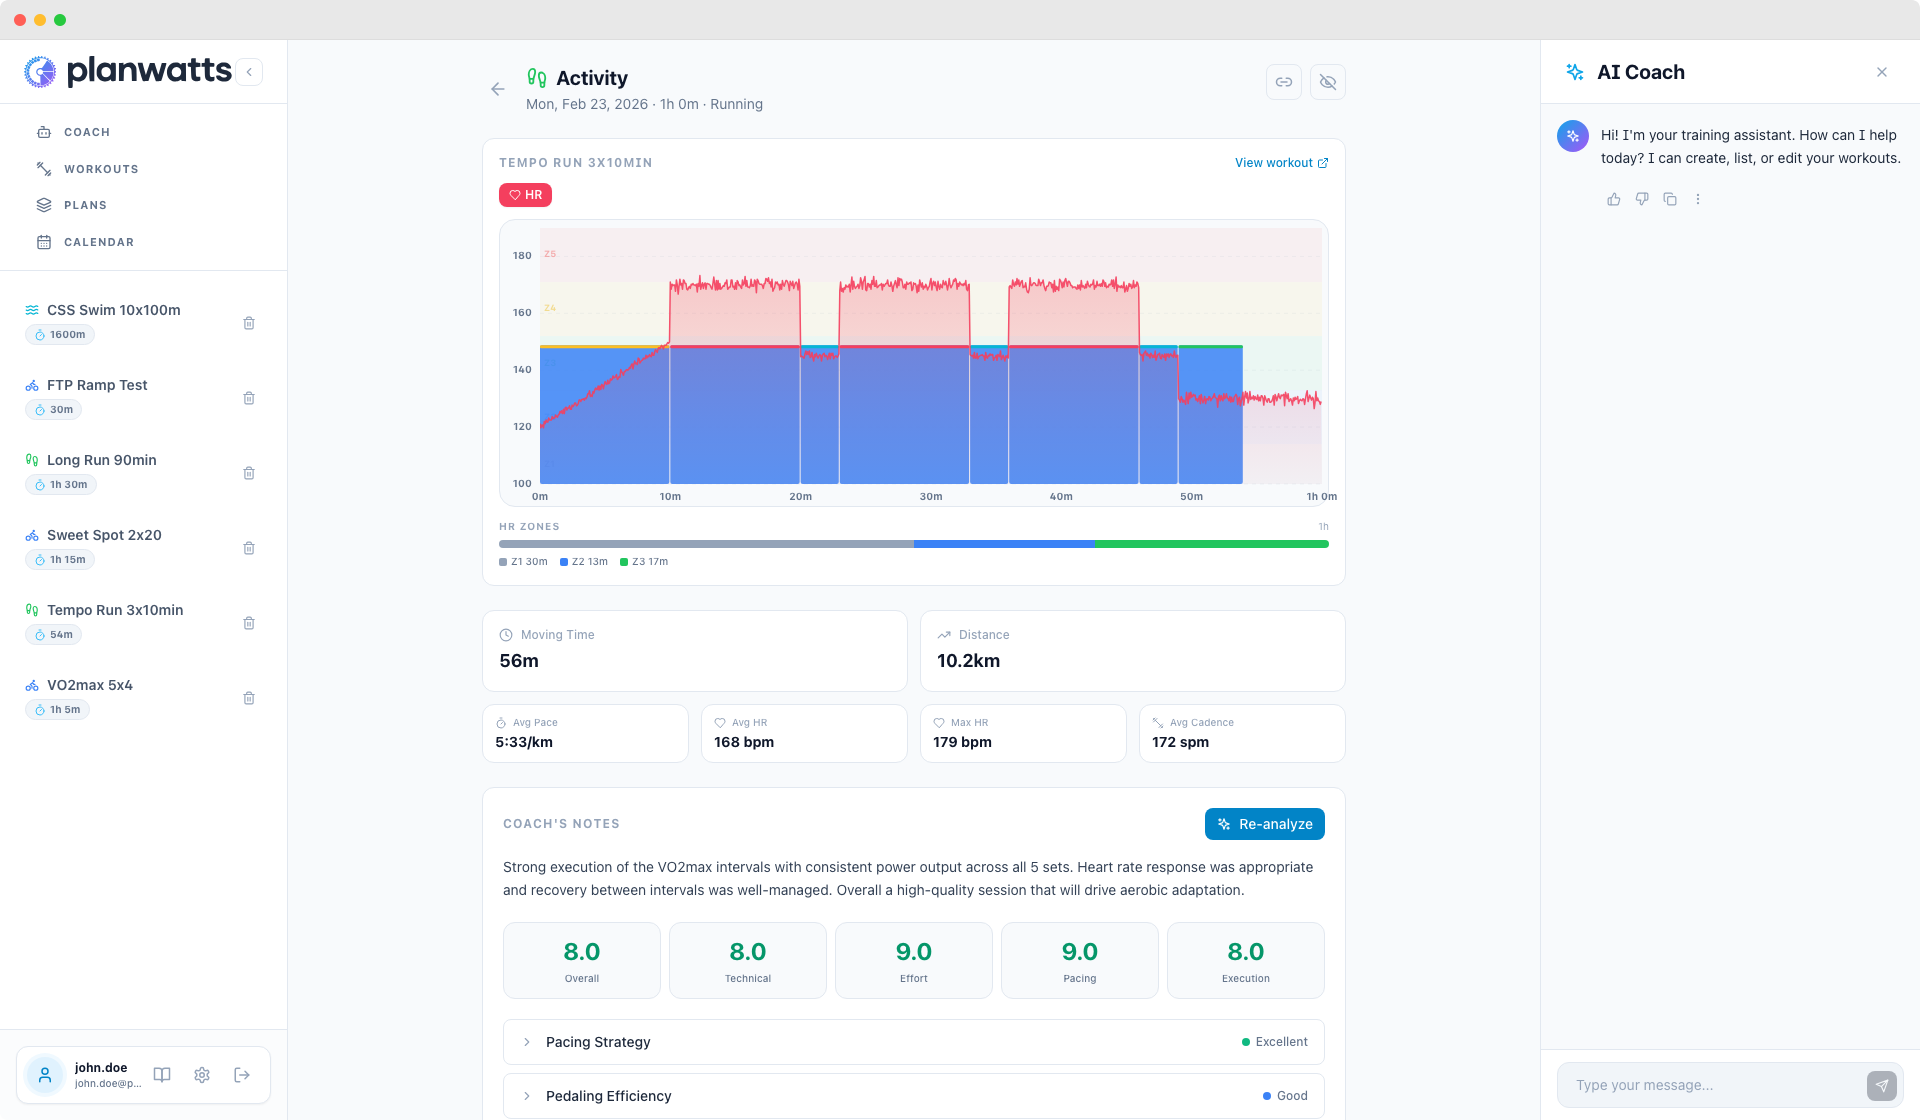
PlanWatts supports 10 sport categories, and the entire analysis page adapts:
| Sport | Icon Color | Score Labels | Key Analysis Sections |
|---|---|---|---|
| Cycling | Blue | Overall, Effort, Execution, Pacing, Technical | Power analysis, interval execution, cadence |
| Running | Green | Overall, Effort, Execution, Pacing, Technical | Pacing splits, HR response, stride |
| Swimming | Cyan | Overall, Effort, Execution, Pacing, Technical | Lap splits, stroke efficiency |
| Strength | Orange | Overall, Effort, Execution, Form | Rep quality, rest periods, volume |
| Yoga | Purple | Overall, Effort, Alignment | Balance, breathing, hold quality |
| Hiking | Amber | Overall, Effort, Pacing | Elevation management, HR response |
| Walking | Lime | Overall, Effort, Pacing | HR response, consistency |
| Rowing | Indigo | Overall, Effort, Execution, Pacing, Technical | Stroke rate, power consistency |
| Skiing | Sky | Overall, Effort, Pacing, Technical | Run intensity, elevation |
| Other | Slate | Overall, Effort | General metrics |
The chart, metrics grid, zone distributions, and analysis sections all adapt.
3. Sharing
Visibility Toggle
Every activity defaults to private. Click the eye icon to toggle between public and private.
Copy Share Link
Click the link icon to copy a shareable URL. When you copy the link, PlanWatts captures your chart as an OG image.
How the Public Page Looks
Clean layout with no navigation, no login prompts. A subtle CTA invites people to try PlanWatts.
See also: Activity Analysis